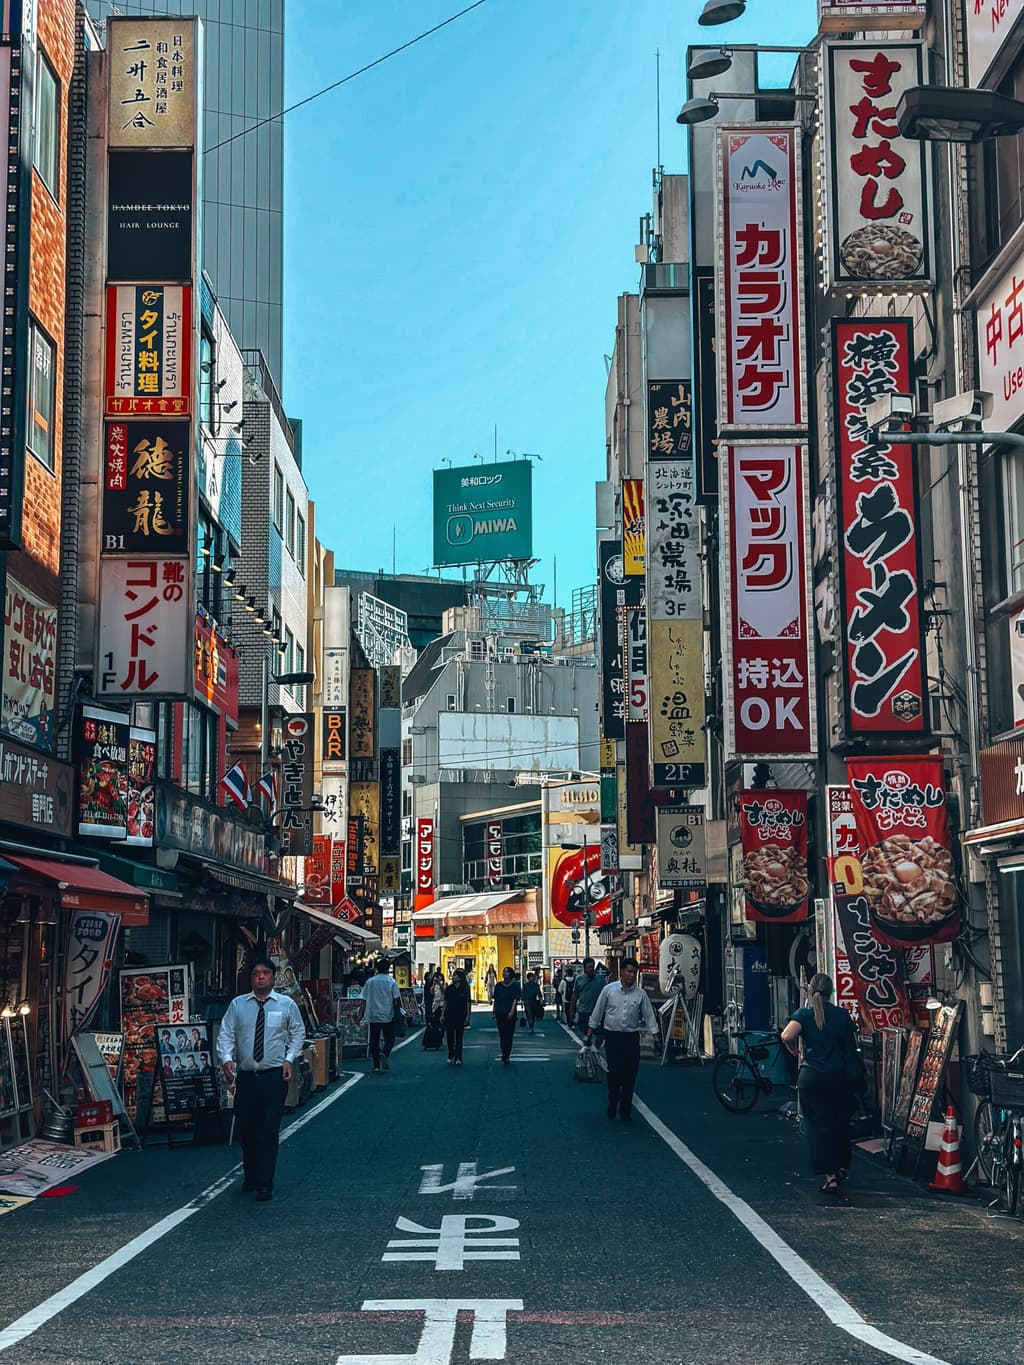
Current forecast models from agencies like the Japan Meteorological Agency (JMA) and global ensembles position 34°C as the leading outcome for Tokyo’s August 2 daytime high, reflecting a stable subtropical Pacific high that favors clear skies and modest subsidence warming without strong frontal passages or typhoon influences. Recent JMA seasonal outlooks and ongoing heatwave conditions across the Kanto region—where late-July highs repeatedly exceeded 35–38°C—support above-normal temperatures for early August, yet urban heat island effects and typical diurnal ranges keep the most probable peak near 33–35°C rather than extremes. Ensemble spreads and short-range model runs show limited upside risk above 36°C or downside below 33°C absent rapid changes in steering flow or moisture advection, aligning with the market-implied probabilities concentrated in this narrow band. Updated guidance from official agencies over the next 24 hours will likely refine these odds as resolution nears.
Experimental AI-generated summary referencing Polymarket data. This is not trading advice and plays no role in how this market resolves. · UpdatedHighest temperature in Tokyo on August 2?
Highest temperature in Tokyo on August 2?
34°C 38%
35°C 26%
33°C 22%
36°C 13%
$18,207 Vol.
$18,207 Vol.
30°C or below
<1%
31°C
2%
32°C
3%
33°C
22%
34°C
38%
35°C
26%
36°C
13%
37°C
4%
38°C
1%
39°C
<1%
40°C or higher
<1%
34°C 38%
35°C 26%
33°C 22%
36°C 13%
$18,207 Vol.
$18,207 Vol.
30°C or below
<1%
31°C
2%
32°C
3%
33°C
22%
34°C
38%
35°C
26%
36°C
13%
37°C
4%
38°C
1%
39°C
<1%
40°C or higher
<1%
The resolution source for this market will be information from Wunderground, specifically the highest temperature recorded for all times on this day for the Tokyo Haneda Airport Station, available here: https://www.wunderground.com/history/daily/jp/tokyo/RJTT.
To toggle between Fahrenheit and Celsius, click the gear icon next to the search bar and switch the Temperature setting between °F and °C.
This market can not resolve until the first data point for the following date has been published on the resolution source.
The resolution source for this market measures temperatures to whole degrees Celsius (eg, 9°C). Thus, this is the level of precision that will be used when resolving the market.
Revisions to temperatures recorded within this market's timeframe will be considered until the first datapoint for the following date has been published, after which any alterations will not be considered.
Market Opened: Jul 31, 2026, 12:02 AM ET
Resolution Source
https://www.wunderground.com/history/daily/jp/tokyo/RJTTResolver
0x69c47De9D...The resolution source for this market will be information from Wunderground, specifically the highest temperature recorded for all times on this day for the Tokyo Haneda Airport Station, available here: https://www.wunderground.com/history/daily/jp/tokyo/RJTT.
To toggle between Fahrenheit and Celsius, click the gear icon next to the search bar and switch the Temperature setting between °F and °C.
This market can not resolve until the first data point for the following date has been published on the resolution source.
The resolution source for this market measures temperatures to whole degrees Celsius (eg, 9°C). Thus, this is the level of precision that will be used when resolving the market.
Revisions to temperatures recorded within this market's timeframe will be considered until the first datapoint for the following date has been published, after which any alterations will not be considered.
Resolution Source
https://www.wunderground.com/history/daily/jp/tokyo/RJTTResolver
0x69c47De9D...Current forecast models from agencies like the Japan Meteorological Agency (JMA) and global ensembles position 34°C as the leading outcome for Tokyo’s August 2 daytime high, reflecting a stable subtropical Pacific high that favors clear skies and modest subsidence warming without strong frontal passages or typhoon influences. Recent JMA seasonal outlooks and ongoing heatwave conditions across the Kanto region—where late-July highs repeatedly exceeded 35–38°C—support above-normal temperatures for early August, yet urban heat island effects and typical diurnal ranges keep the most probable peak near 33–35°C rather than extremes. Ensemble spreads and short-range model runs show limited upside risk above 36°C or downside below 33°C absent rapid changes in steering flow or moisture advection, aligning with the market-implied probabilities concentrated in this narrow band. Updated guidance from official agencies over the next 24 hours will likely refine these odds as resolution nears.
Experimental AI-generated summary referencing Polymarket data. This is not trading advice and plays no role in how this market resolves. · Updated
Beware of external links.
Beware of external links.
Frequently Asked Questions